For dairy farmers across Nepal, profitability hinges on a delicate balance between milk yield and the costs incurred to produce it. While market prices can be unpredictable, managing your operational expenses is something you can directly control. Reducing the cost of milk production does not mean cutting corners or sacrificing quality. Instead, it involves adopting smarter, more efficient practices that enhance productivity and boost your bottom line.
From the high Himalayas to the fertile Terai, farmers face unique challenges. However, the principles of cost optimization remain universal. By focusing on key areas like feed management, animal health, genetic improvement, and sustainable practices, you can build a more resilient and profitable dairy operation.
This expanded guide uses recent scientific research, visual infographics, and comparative data to provide an even deeper, action-focused look at cost-saving on Nepali dairy farms.
Takeaway: Targeting feed and health expenditures yields the biggest savings.
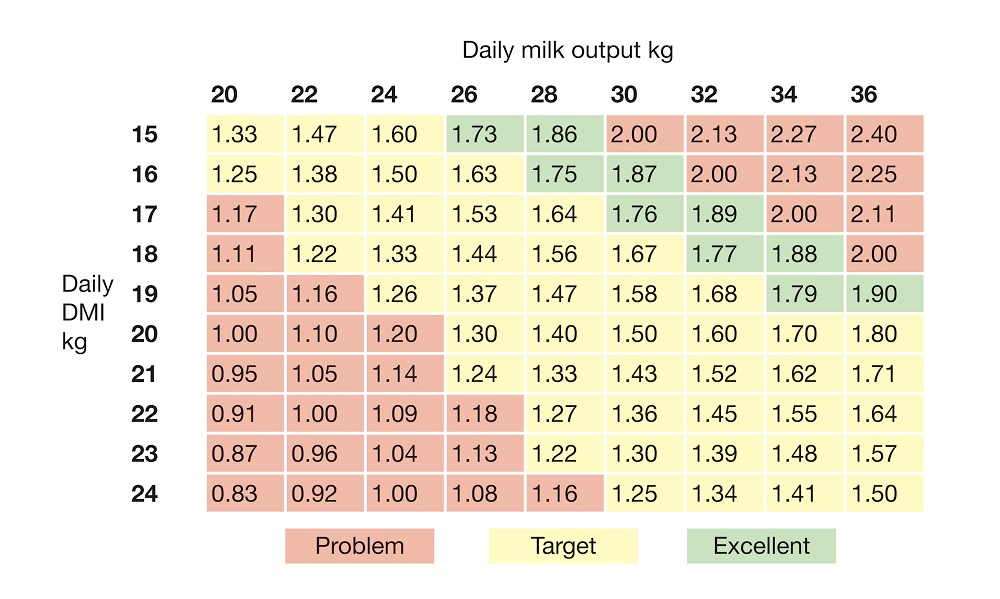
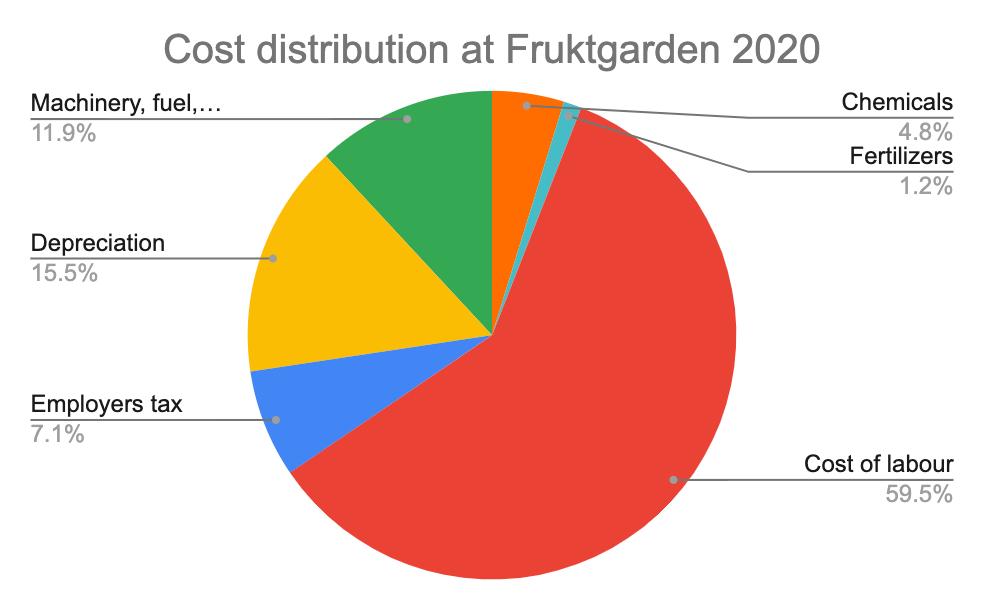
Feed is the single largest expense in dairy farming, often accounting for over 60-70% of total production costs. FAO studies (2021) and NARC research consistently show that optimized feed strategies can improve milk yield by 25-35% and lower total feed expenditures by up to 20%.
| Feed Option | Cost per Animal/Day (NPR) | Yield Increase (%) | Digestibility Score | Cost Effectiveness |
|---|---|---|---|---|
| Napier Grass | 45 | 18 | 4/5 | High |
| Berseem/Alfalfa | 50 | 22 | 5/5 | High |
| Maize/Oat Silage | 35 | 10 | 3.5/5 | Moderate |
| Commercial Pellets | 90 | 25 | 5/5 | Moderate |
| Crop Residue + UMS | 20 | 8 | 3/5 | Highest (per cost) |
Balanced rations not only reduce waste but also boost immunity and reproductive performance.
| Feed Additive | Scientific Benefit | Cost per Day (NPR/animal) | ROI (Yield/Cost) |
|---|---|---|---|
| Mineral/Vitamin Mix | Improved milk yield, disease resistance | 5 | High |
| Probiotics | Digestion, reduced bloat, better yield | 3 | Moderate |
| Bypass Protein | Enhances protein utilization, higher yield | 6 | Variable |
Study Highlight: A 2020 Kathmandu field study showed that farms adopting mineral supplementation produced 9% more milk with only a 3% increase in feed costs.
Investing in preventive care drastically reduces costly outbreaks.
| Practice | Cost per Animal/Year (NPR) | Typical Savings (NPR) | Science-Backed Outcomes |
|---|---|---|---|
| Vaccination & Deworming | 250 | 700+ | Reduced disease incidence |
| Mastitis Hygiene Protocol | 350 | 900+ | Higher yield, less milk loss |
| Prophylactic Mineral Mix | 200 | 350+ | Fewer fertility issues |
Research Note: Mastitis prevention (proper cleaning, teat dipping) alone can save Nepali farmers up to 14% in rejected milk annually (AgriScience Nepal, 2023).
| Practice | Initial Outlay (NPR) | Yearly Savings (NPR) | Additional Benefits |
|---|---|---|---|
| Biogas Plant | 40,000–60,000 | 6,500+ | Reduced fuel, better fertilizer |
| Composting | Minimal | 2,000+ | Soil health, waste reduction |
Crossbreeding and artificial insemination (AI) boost both yield and feed efficiency (“ICIMOD Genetics Trials,” 2022-2023).
| Breeding Intervention | Extra Cost/Animal | Average Milk Yield Gain (%) | Cost Savings Over 5 Years |
|---|---|---|---|
| Crossbreeding/AI | 1,500 | 18–22 | 9,000–12,000 (higher lifetime) |
| Selective Retention | 0 | Up to 12 | Culling low producers boosts herd yield |
Adopting even simple tech—like cow health apps, milk meters, and solar water heaters—translates to measurable savings (FAO, “Tech Adoption in Smallholder Dairy,” 2023).
| Technology Adopted | Upfront Cost | Payback Period | Net Savings After 3 Years |
|---|---|---|---|
| Digital Record-Keeping App | NPR 2,000 | <1 year | NPR 5,500 |
| Solar Water Heater | NPR 15,000 | 1–2 years | NPR 10,000 |
| Automated Watering System | NPR 5,000 | 1 year | NPR 3,000 |

Reducing the cost of milk production isn’t a one-off event—it’s an ongoing, knowledge-driven process. By implementing strategies proven by local and international research—optimizing feed, prioritizing herd health, embracing sustainability, leveraging modern genetics, and using technology—you unlock higher profits, stability, and long-term farm resilience.
Begin with one actionable insight—whether that’s integrating Napier in your feed, scheduling regular vaccinations, or adopting digital records. Let science and smart decision-making guide your farm to a more prosperous future